Charts Getting Started
From mtab wikisupport
Introduction
The chart package in mTAB has been given a complete update to include the additional charting and graphing options, more customization and control over creating visualizations in mTAB, and the ability to export the visualizations from mTAB into native, editable PowerPoint and Excel files. The actual data used to create the chart will be included in the PowerPoint or Excel files.
Getting Started
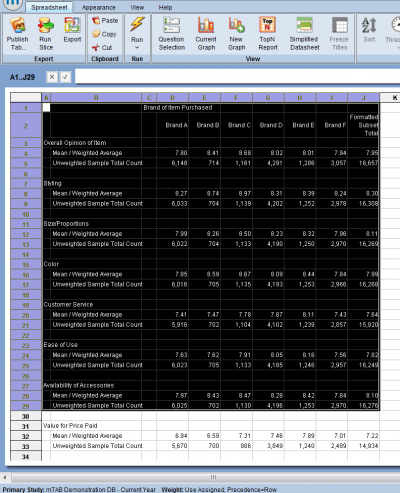
To start, setup your questions in rows, columns, etc. and click the lightning bolt. You'll be taken to the spreadsheet view. Next, select the data range that you want to create a chart from by highlighting the cells to include in the chart.
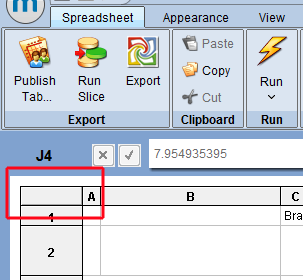
 If you want to include the entire contents of the spreadsheet, you can click the upper-left rectangle between the A & 1.
